| FindBook |
有 1 項符合
Programming Graphical User Interfaces in R的圖書 |
 |
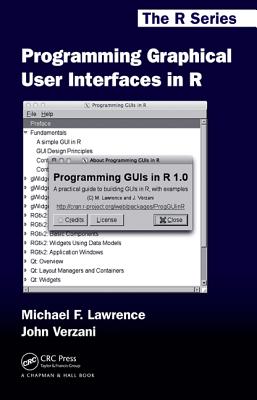
Programming Graphical User Interfaces in R 作者:Lawrence,Michael F./Verzani,John 出版社:Taylor & Francis 出版日期:2012-06-08 語言:英文 規格:15.9 x 24.1 x 2.5 cm / 普通級/ 雙色印刷 |
| 圖書館借閱 |
| 國家圖書館 | 全國圖書書目資訊網 | 國立公共資訊圖書館 | 電子書服務平台 | MetaCat 跨館整合查詢 |
| 臺北市立圖書館 | 新北市立圖書館 | 基隆市公共圖書館 | 桃園市立圖書館 | 新竹縣公共圖書館 |
| 苗栗縣立圖書館 | 臺中市立圖書館 | 彰化縣公共圖書館 | 南投縣文化局 | 雲林縣公共圖書館 |
| 嘉義縣圖書館 | 臺南市立圖書館 | 高雄市立圖書館 | 屏東縣公共圖書館 | 宜蘭縣公共圖書館 |
| 花蓮縣文化局 | 臺東縣文化處 |
|
|
圖書介紹 - 資料來源:博客來 評分:
圖書名稱:Programming Graphical User Interfaces in R
內容簡介
'Preface About this book Two common types of user interfaces in statistical computing are the command line interface (CLI) and the graphical user interface (GUI). The usual CLI consists of a textual console in which the user types a sequence of commands at a prompt, and the output of the commands is printed to the console as text. The R console is an example of a CLI. A GUI is the primary means of interacting with desktop environments, such as Windows and Mac OS X, and statistical software, such as JMP. GUIs are contained within windows, and resources, such as documents, are represented by graphical icons. User controls are packed into hierarchical drop-down menus, buttons, sliders, etc. The user manipulates the windows, icons, and menus with a pointer device, such as a mouse. The R language, like its predecessor S, is designed for interactive use through a command line interface (CLI), and the CLI remains the primary interface to R. However, the graphical user interface (GUI) has emerged as an effectivealternative, depending on the specific task and the target audience. With respect to GUIs, we see R users falling into three main target audiences: those who are familiar with programming R, those who are still learning how to program, and those who haveno interest in programming. On some platforms, such as Windows and Mac OS X, R has graphical front-ends that provide a CLI through a text console control. Similar examples include the multi-platform RStudioTM IDE, the Java-based JGR and the RKWard GUI for the Linux KDE desktop. Although these interfaces are GUIs, they are still very much in essence CLIs, in that the primary mode of interacting with R is the same. Thus, these GUIs appeal mostly to those who are comfortable with R programming'--
|


