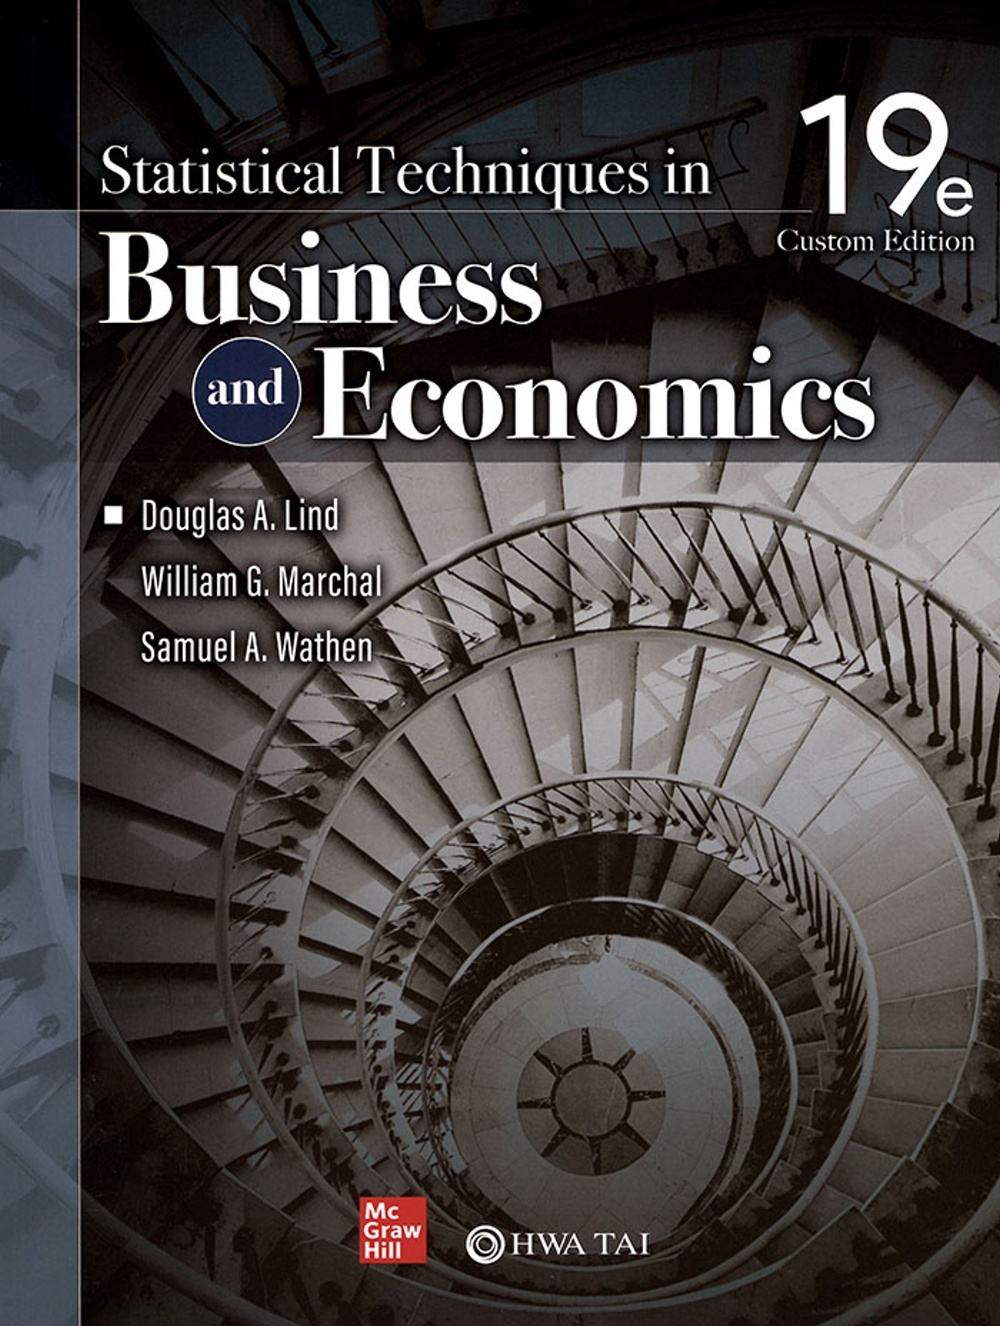
From its origins in 1976, Statistical Techniques in Business and Economics has become a best seller, providing students across the business specialisms with an introductory survey of descriptive and inferential statistics. With a step-by-step approach and clear writing style, any student can learn and succeed in Business Statistics.
The new edition includes a focus on the development of basic data analytical skills. Microsoft Excel, Minitab, and MegaStat are used throughout the text to illustrate statistical software analyses, and screen captures are used within the chapters, so the student becomes familiar with the nature of the software output. Additional resources are available online through Connect, with references or links in the text to Excel tutorials that provide users with clear demonstrations using statistical software to create graphical and descriptive statistics and analyses to test hypotheses.
What's changed:
The Nineteenth Edition made several changes to the flow and organization of the text by adding the sampling distribution of the proportion to Chapter 8, moving the one- and two-sample tests of hypothesis for proportions to Chapters 10, preceding the two-sample tests of hypothesis in Chapter 11 with the F-distribution, and the revision of several Chapter introductions.
Many of the calculation examples have been replaced with interpretative ones to help students understand and interpret the statistical results with more emphasis on the conceptual nature of the topics.
This edition also brings a renewed recognition of diversity, equity, and inclusion to the text, exercises, and examples through an increased diversity of persons and businesses from varied geographic, ethnic, and cultural groups.
| FindBook |
有 1 項符合
Statistical Techniques in Business and Economics(Custom Edition)(19版)的圖書 |
 |
Statistical Techniques in Business and Economics(Custom Edition)(19版) 作者:Douglas A. Lind 出版社:華泰文化 出版日期:2024-05-10 語言:英文 規格:平裝 / 787頁 / 20.3 x 26.7 x 2.6 cm / 普通級/ 全彩印刷 / 19版 |
| 圖書館借閱 |
| 國家圖書館 | 全國圖書書目資訊網 | 國立公共資訊圖書館 | 電子書服務平台 | MetaCat 跨館整合查詢 |
| 臺北市立圖書館 | 新北市立圖書館 | 基隆市公共圖書館 | 桃園市立圖書館 | 新竹縣公共圖書館 |
| 苗栗縣立圖書館 | 臺中市立圖書館 | 彰化縣公共圖書館 | 南投縣文化局 | 雲林縣公共圖書館 |
| 嘉義縣圖書館 | 臺南市立圖書館 | 高雄市立圖書館 | 屏東縣公共圖書館 | 宜蘭縣公共圖書館 |
| 花蓮縣文化局 | 臺東縣文化處 |
|
|
圖書介紹 - 資料來源:博客來 評分:
圖書名稱:Statistical Techniques in Business and Economics(Custom Edition)(19版)
內容簡介
作者介紹
作者簡介
Douglas A. Lind
現職:Coastal Carolina University and The University of Toledo
Willian G. Marchal
現職:The University of Toledo
Samuel A. Wathen
現職:Coastal Carolina University
Douglas A. Lind
現職:Coastal Carolina University and The University of Toledo
Willian G. Marchal
現職:The University of Toledo
Samuel A. Wathen
現職:Coastal Carolina University
目錄
Ch 1 What Is Statistics?
Ch 2 Describing Data: Frequency Tables, Frequency Distributions, and Graphic Presentation
Ch 3 Describing Data: Numerical Measures
Ch 4 Describing Data: Displaying and Exploring Data
Ch 5 A Survey of Probability Concepts
Ch 6 Discrete Probability Distributions
Ch 7 Continuous Probability Distributions
Ch 8 Sampling, Sampling Methods, and the Central Limit Theorem
Ch 9 Estimation and Confidence Intervals
Ch10 One-Sample Tests of Hypothesis
Ch11 Two-Sample Tests of Hypothesis
Ch12 Analysis of Variance
Ch13 Correlation and Linear Regression
Ch14 Multiple Regression Analysis
Ch15 Nonparametric Methods Nominal Level Hypothesis Tests
Ch16 Nonparametric Methods:Analysis of Ordinal Data
Ch17 Index Numbers
|


