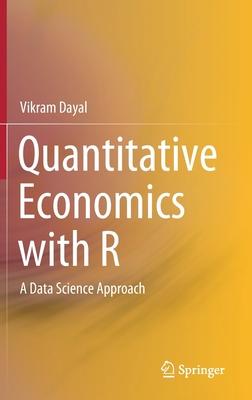
This book provides a contemporary treatment of quantitative economics, with a focus on data science. The book introduces the reader to R and RStudio, and uses expert Hadley Wickham's tidyverse package for different parts of the data analysis workflow. After a gentle introduction to R code, the reader's R skills are gradually honed, with the help of "your turn" exercises.
At the heart of data science is data, and the book equips the reader to import and wrangle data, (including network data). Very early on, the reader will begin using the popular ggplot2 package for visualizing data, even making basic maps. The use of R in understanding functions, simulating difference equations, and carrying out matrix operations is also covered. The book uses Monte Carlo simulation to understand probability and statistical inference, and the bootstrap is introduced. Causal inference is illuminated using simulation, data graphs, and R code for applications with real economic examples, covering experiments, matching, regression discontinuity, difference-in-difference, and instrumental variables. The interplay of growth related data and models is presented, before the book introduces the reader to time series data analysis with graphs, simulation, and examples. Lastly, two computationally intensive methods--generalized additive models and random forests (an important and versatile machine learning method)--are introduced intuitively with applications.
The book will be of great interest to economists--students, teachers, and researchers alike--who want to learn R. It will help economics students gain an intuitive appreciation of applied economics and enjoy engaging with the material actively, while also equipping them with key data science skills.


 2025【精選作文範例】國文(作文)[速成+歷年試題](不動產經紀人)](https://media.taaze.tw/showLargeImage.html?sc=14100120564)